2DA Analytics
Visualizing and optimizing energy commodities for a zero-to-one product launch.
Deliverables
User interviews, Personas, User flows, Agile coaching, Product roadmap, feature prioritization, Prototype, Proof-of-Concept, Pilot
The Challenge
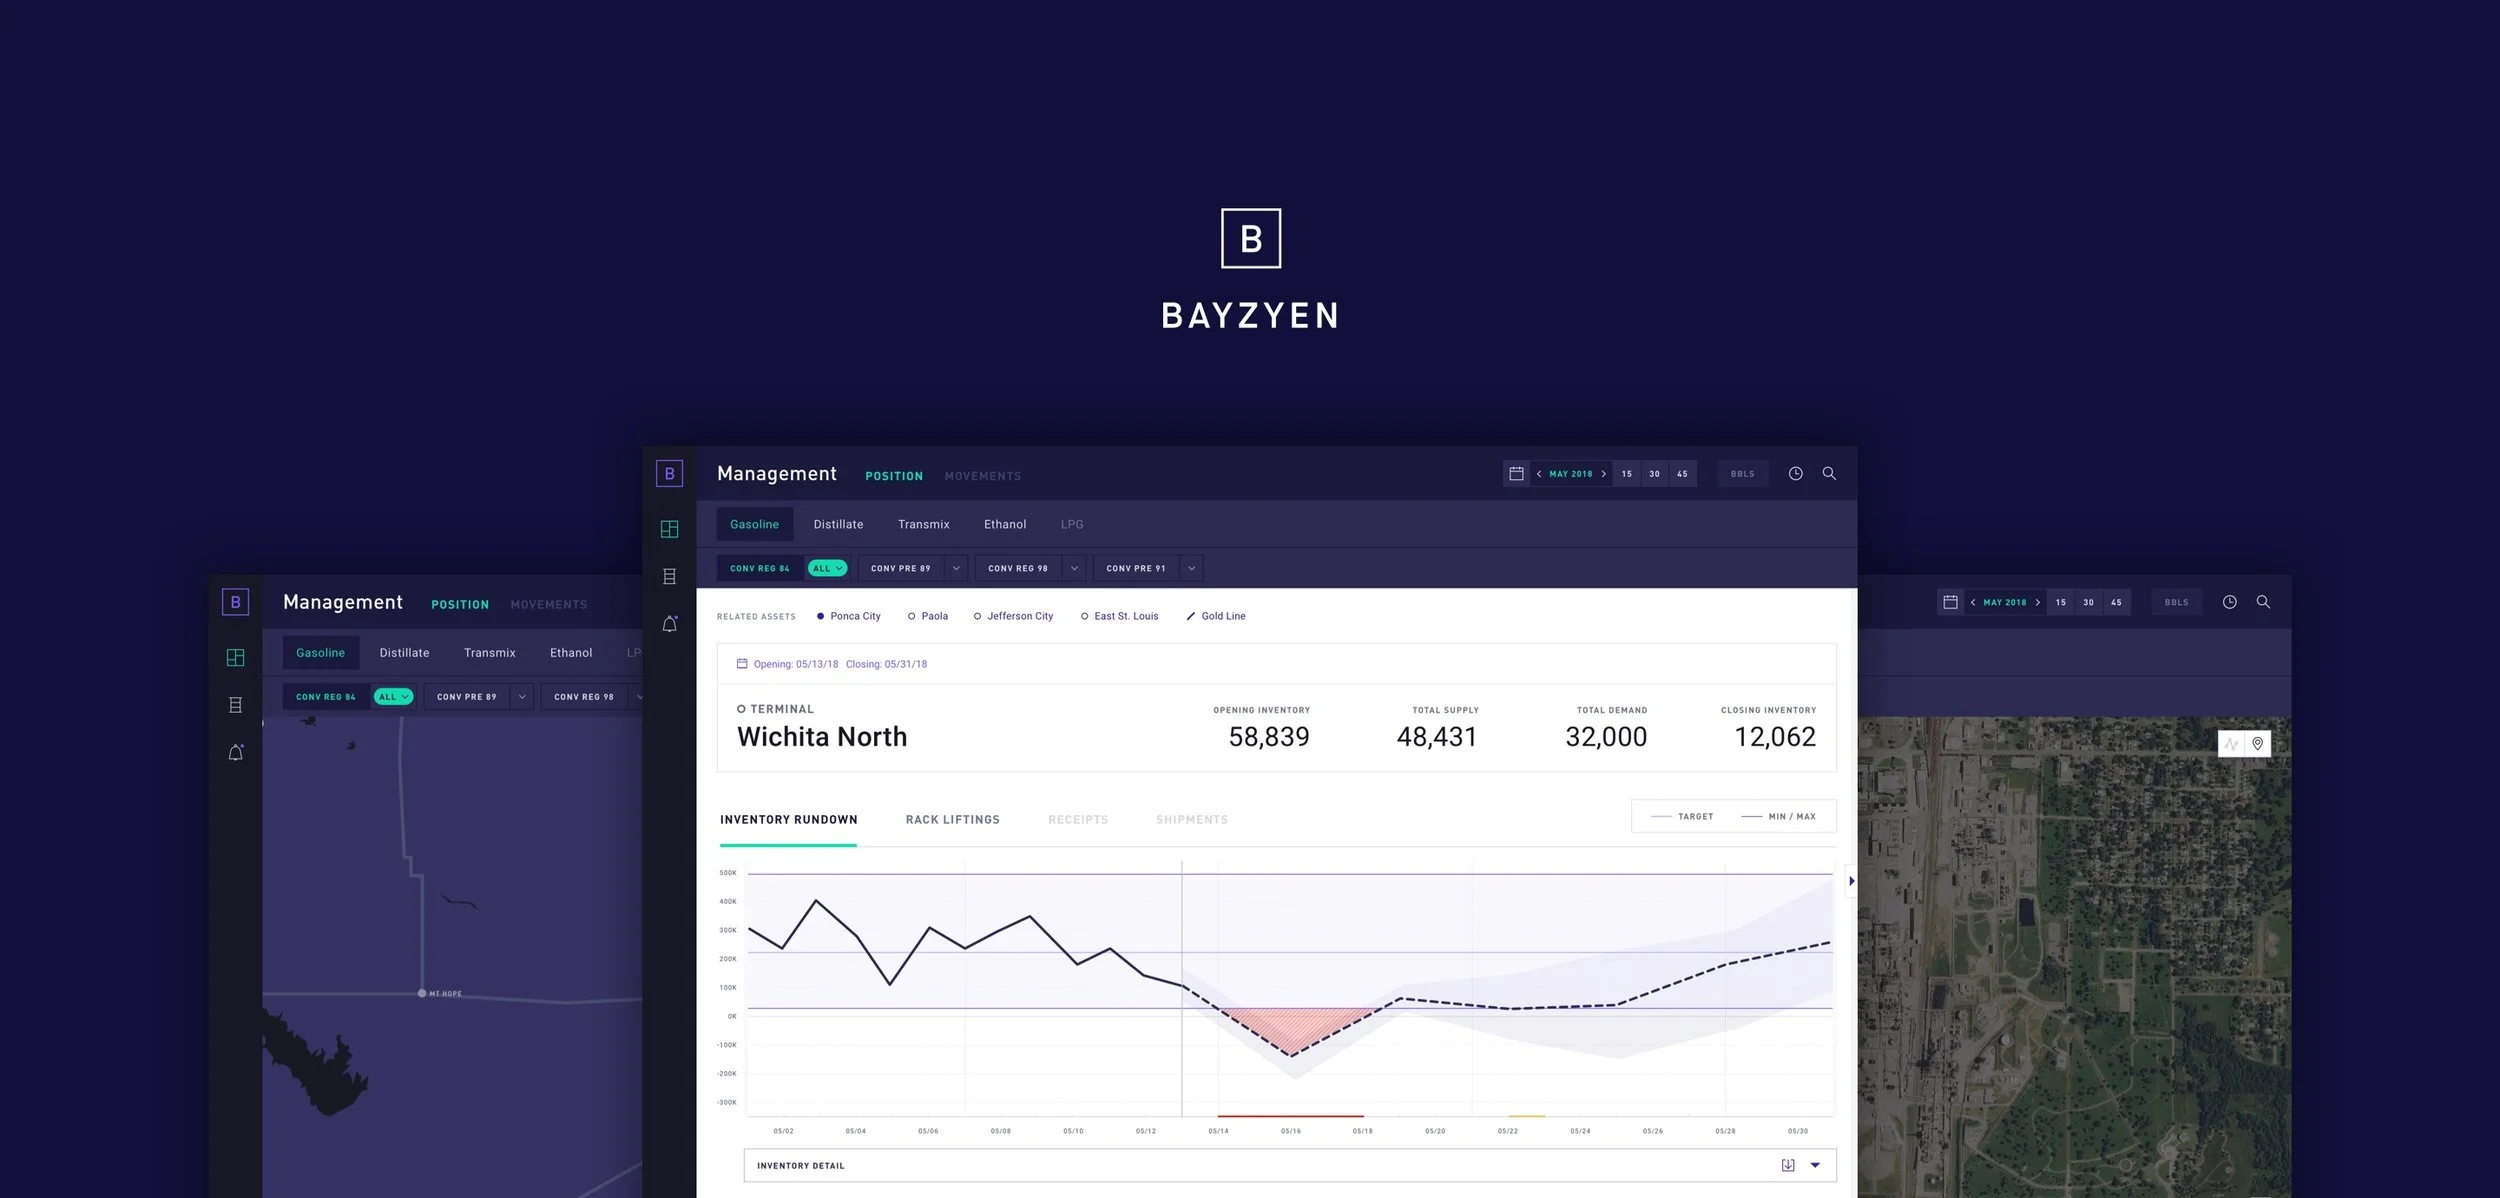
2DA Analytics, a software startup and analytics lab, was looking to develop a supply chain management solution for oil schedulers tracking and managing product shipments from oil refineries. From brand identity to product design to a scalable MVP, we partnered with 2DA to transition from an idea to its first round of seed funding, ultimately helping the company secure a major client in the oil and gas industry.
Consulting & Collaboration
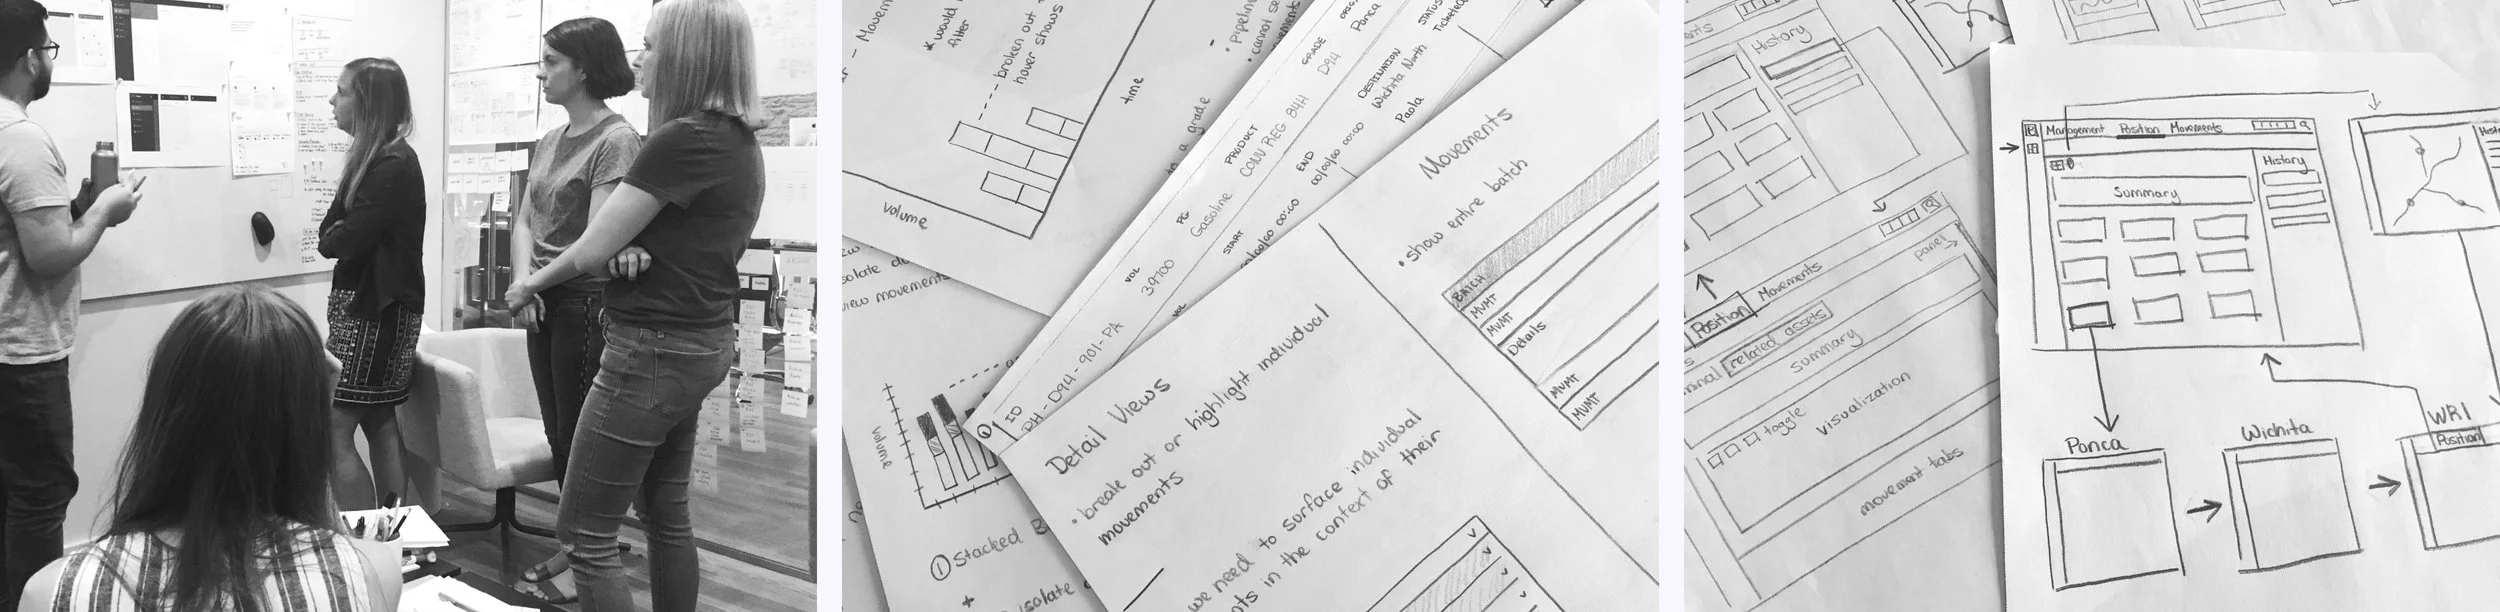
As part of our promise of success for a start-up with little product experience and lofty goals, I collaborated closely with the founders to help coach, guide, and mentor them on user-centered design processes and agile methodologies to get us to MVP launch.
I then led the team to groom, prioritize, and plan the product backlog, all while advising on UX best practices and data visualization.
A Multi-phase Engagement
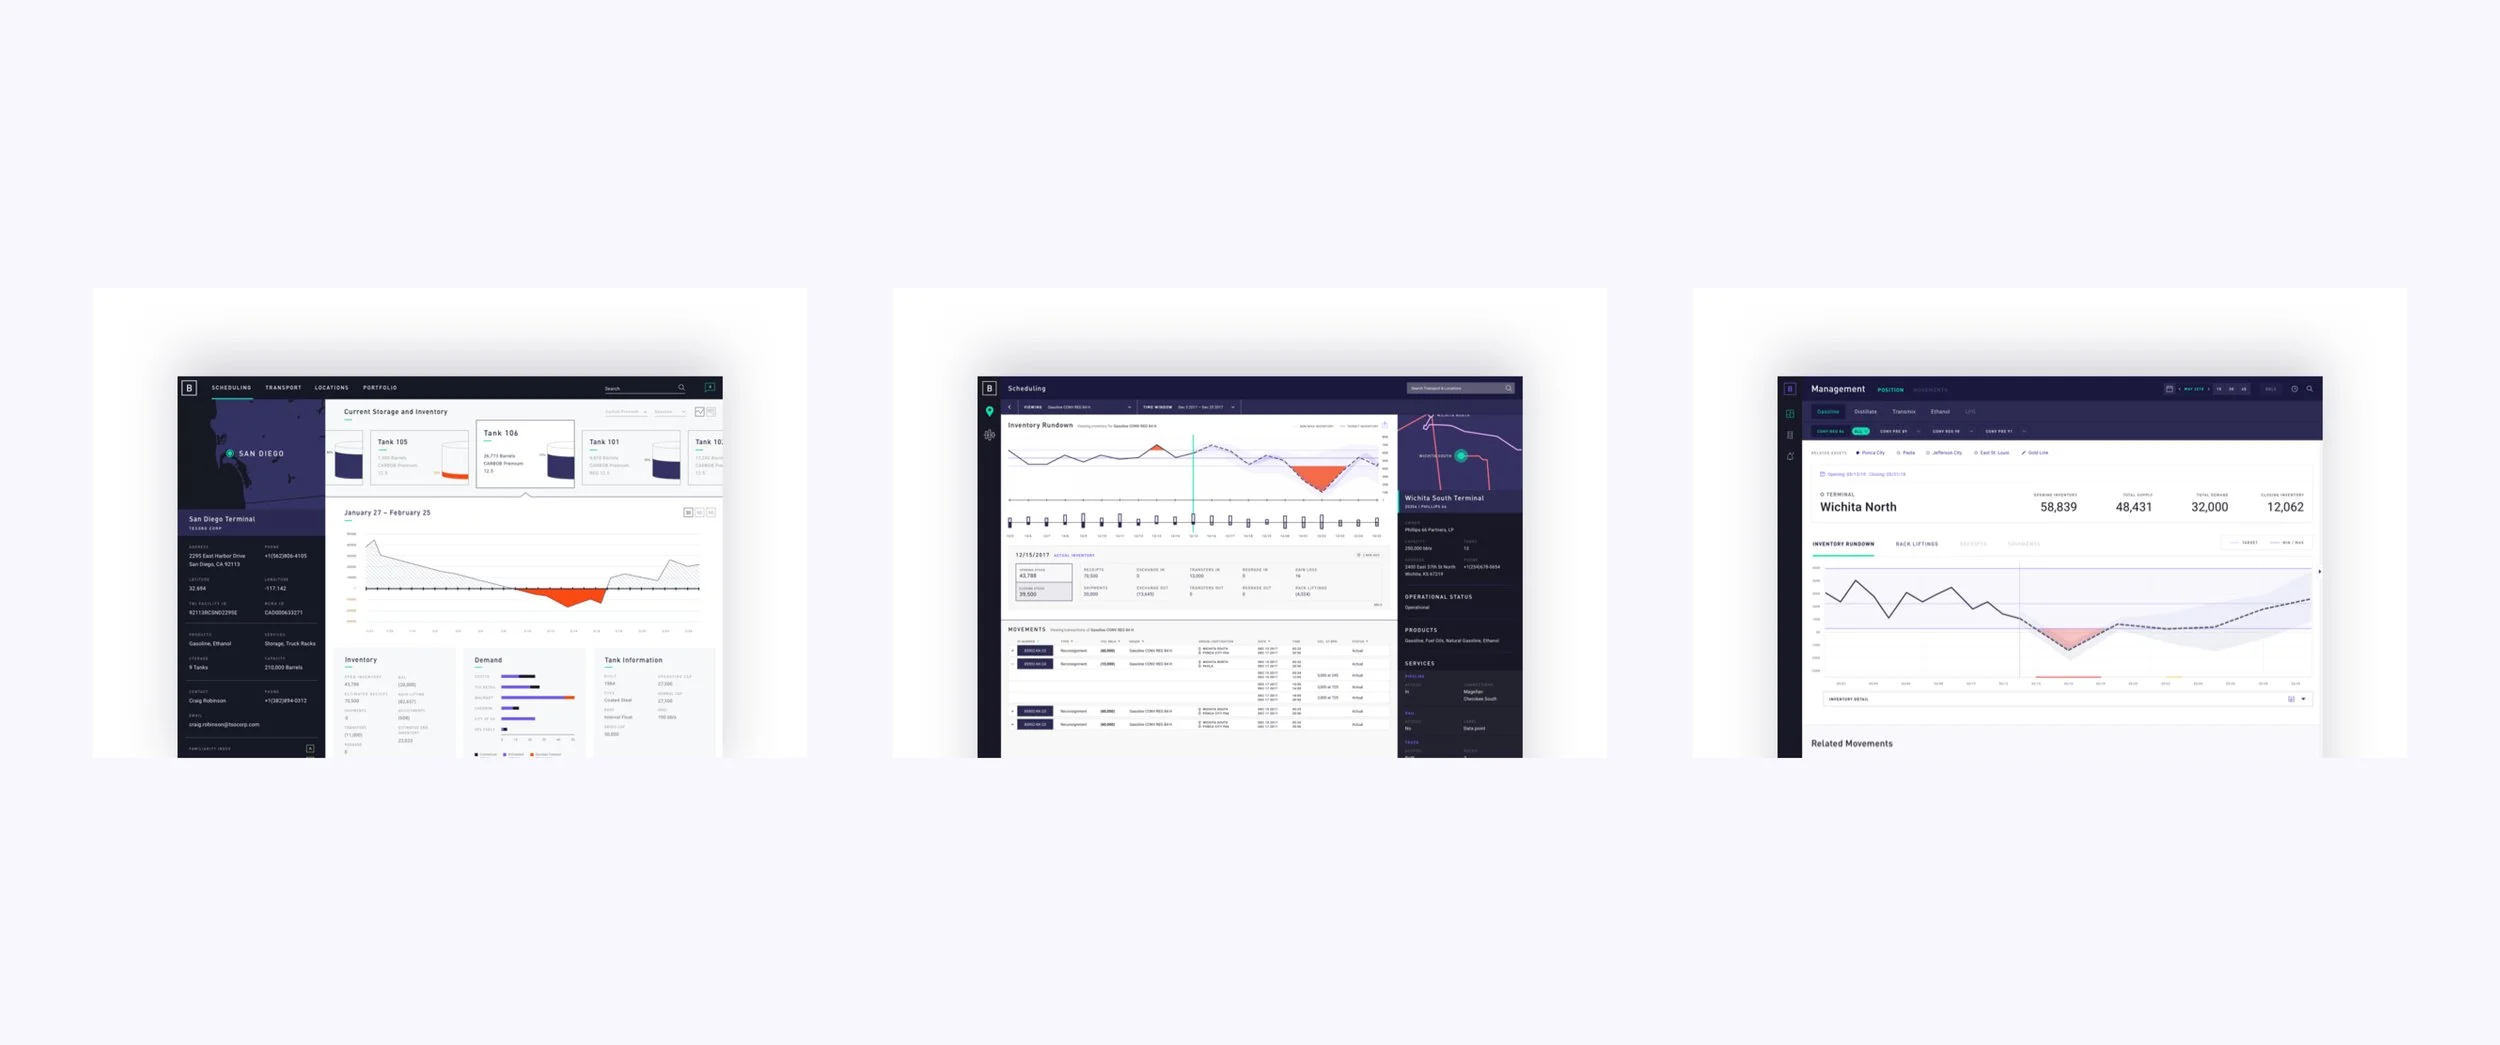
We worked with 2DA to develop Bayzyen over the course of three engagements. With each phase we continued to iterate, improving workflows and screens while expanding the feature set to meet the needs of users.
01. Prototype
Develop a brand, visual language, and screen designs for a high-fidelity prototype.
02. Proof-of-Concept
Refine the information architecture and UI from the prototype to build a functioning demo.
03. Pilot
Continue to build on the previous work to create a functioning application to be validated with users.
Goodbye, Spreadsheets
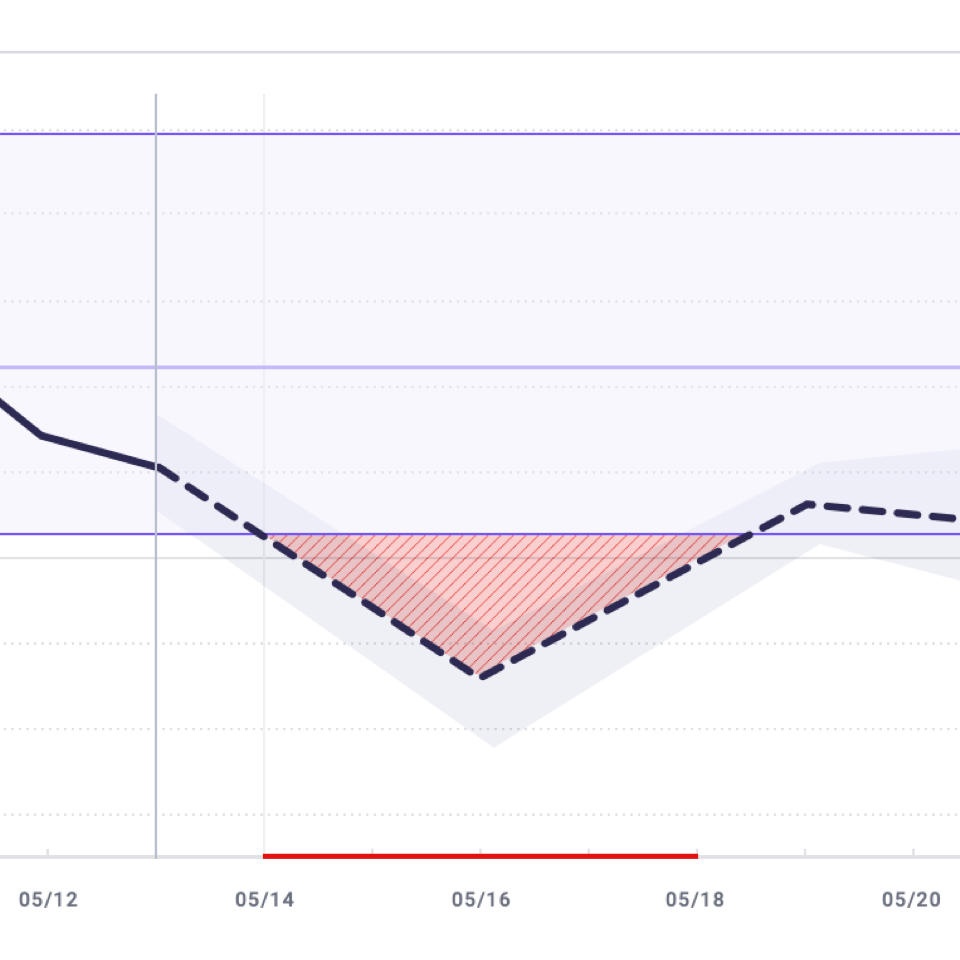
Currently, schedulers manage inventory for multiple products across multiple locations through an intricate system of Excel spreadsheets. Our goal was to help schedulers by providing greater insights into inventory patterns and the ability to better predict upcoming inventory shortfalls by aggregating and visualizing inventory data.
User-Centered
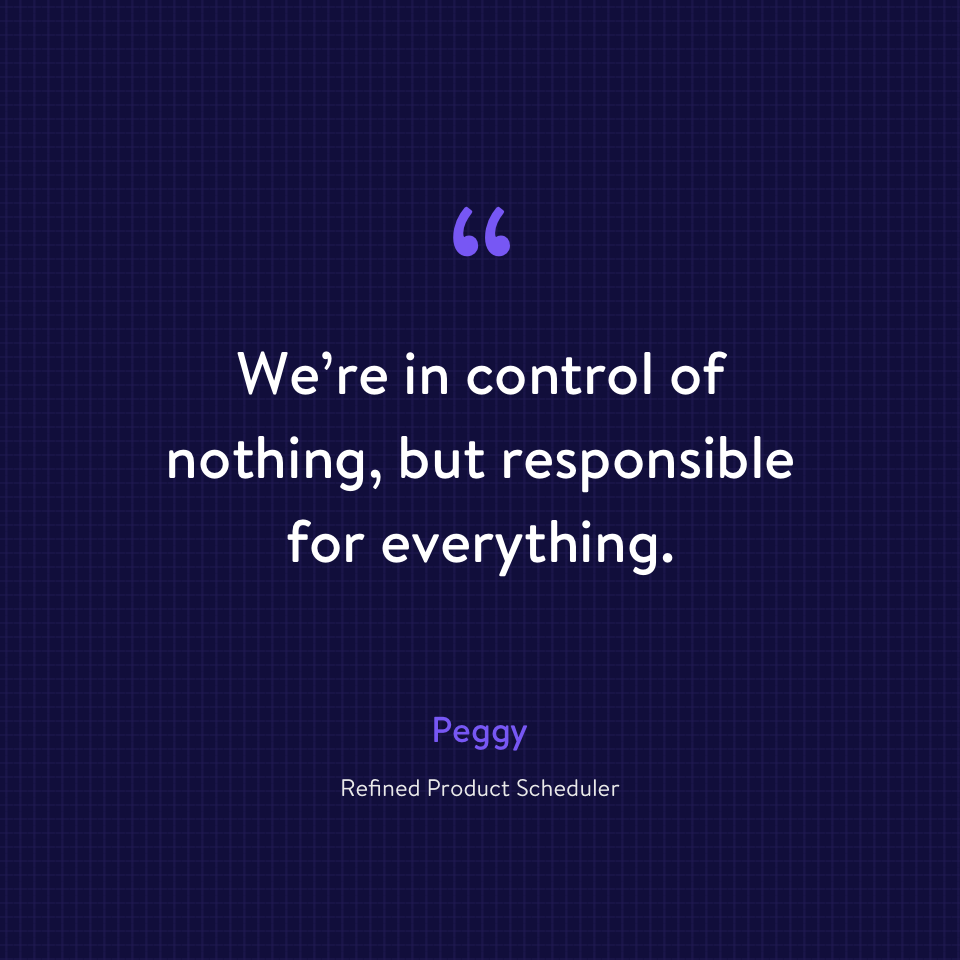
Both design and technology underwent extensive field research to better understand the complexities of supply chain management and to build empathy for the extensive pressures of schedulers who forecast, track, and manage product shipments. We conducted generative interviews that allowed us to map the current workflows and identify user needs and pain points. We then spent numerous hours shadowing schedulers and capturing observations about their workday and behaviors.
Our team synthesized research findings, developed key product insights, prioritized user needs, and mapped the information architecture based on a deep understanding of the user.
Real-time Data
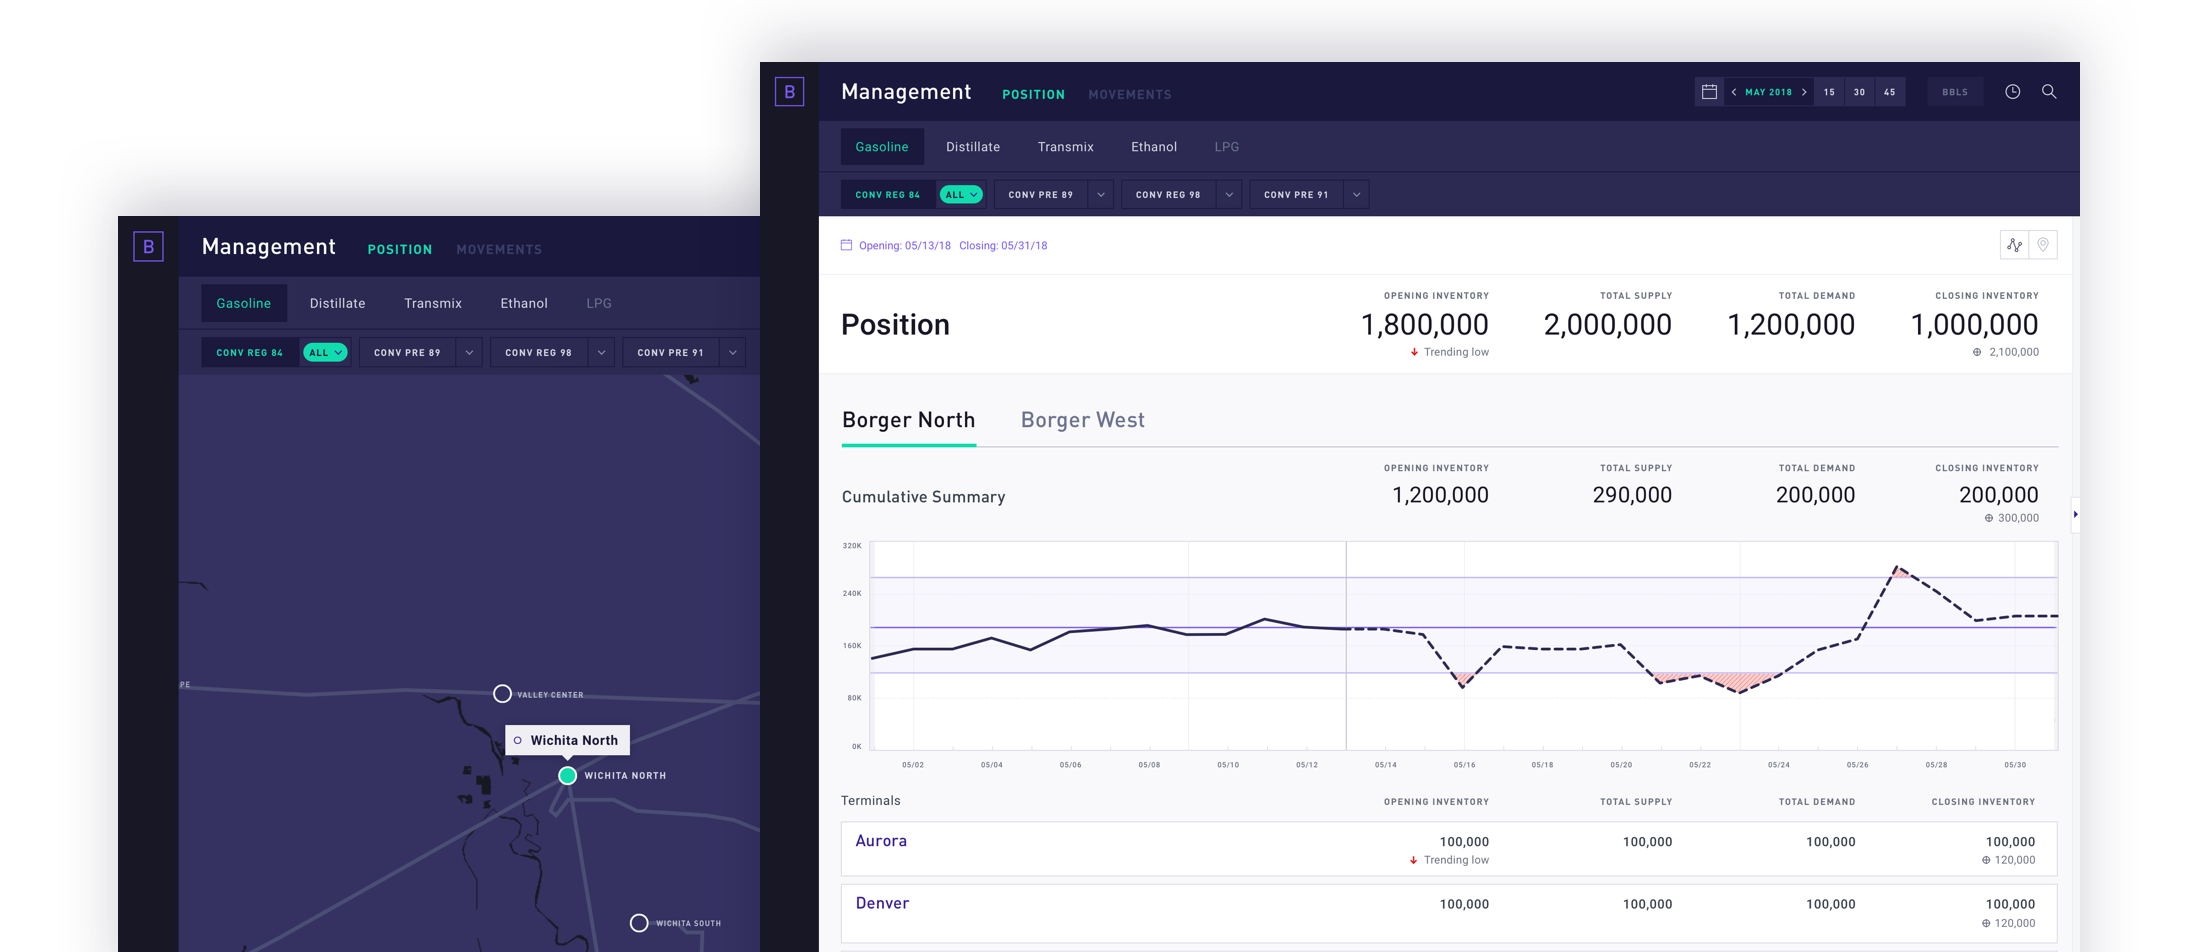
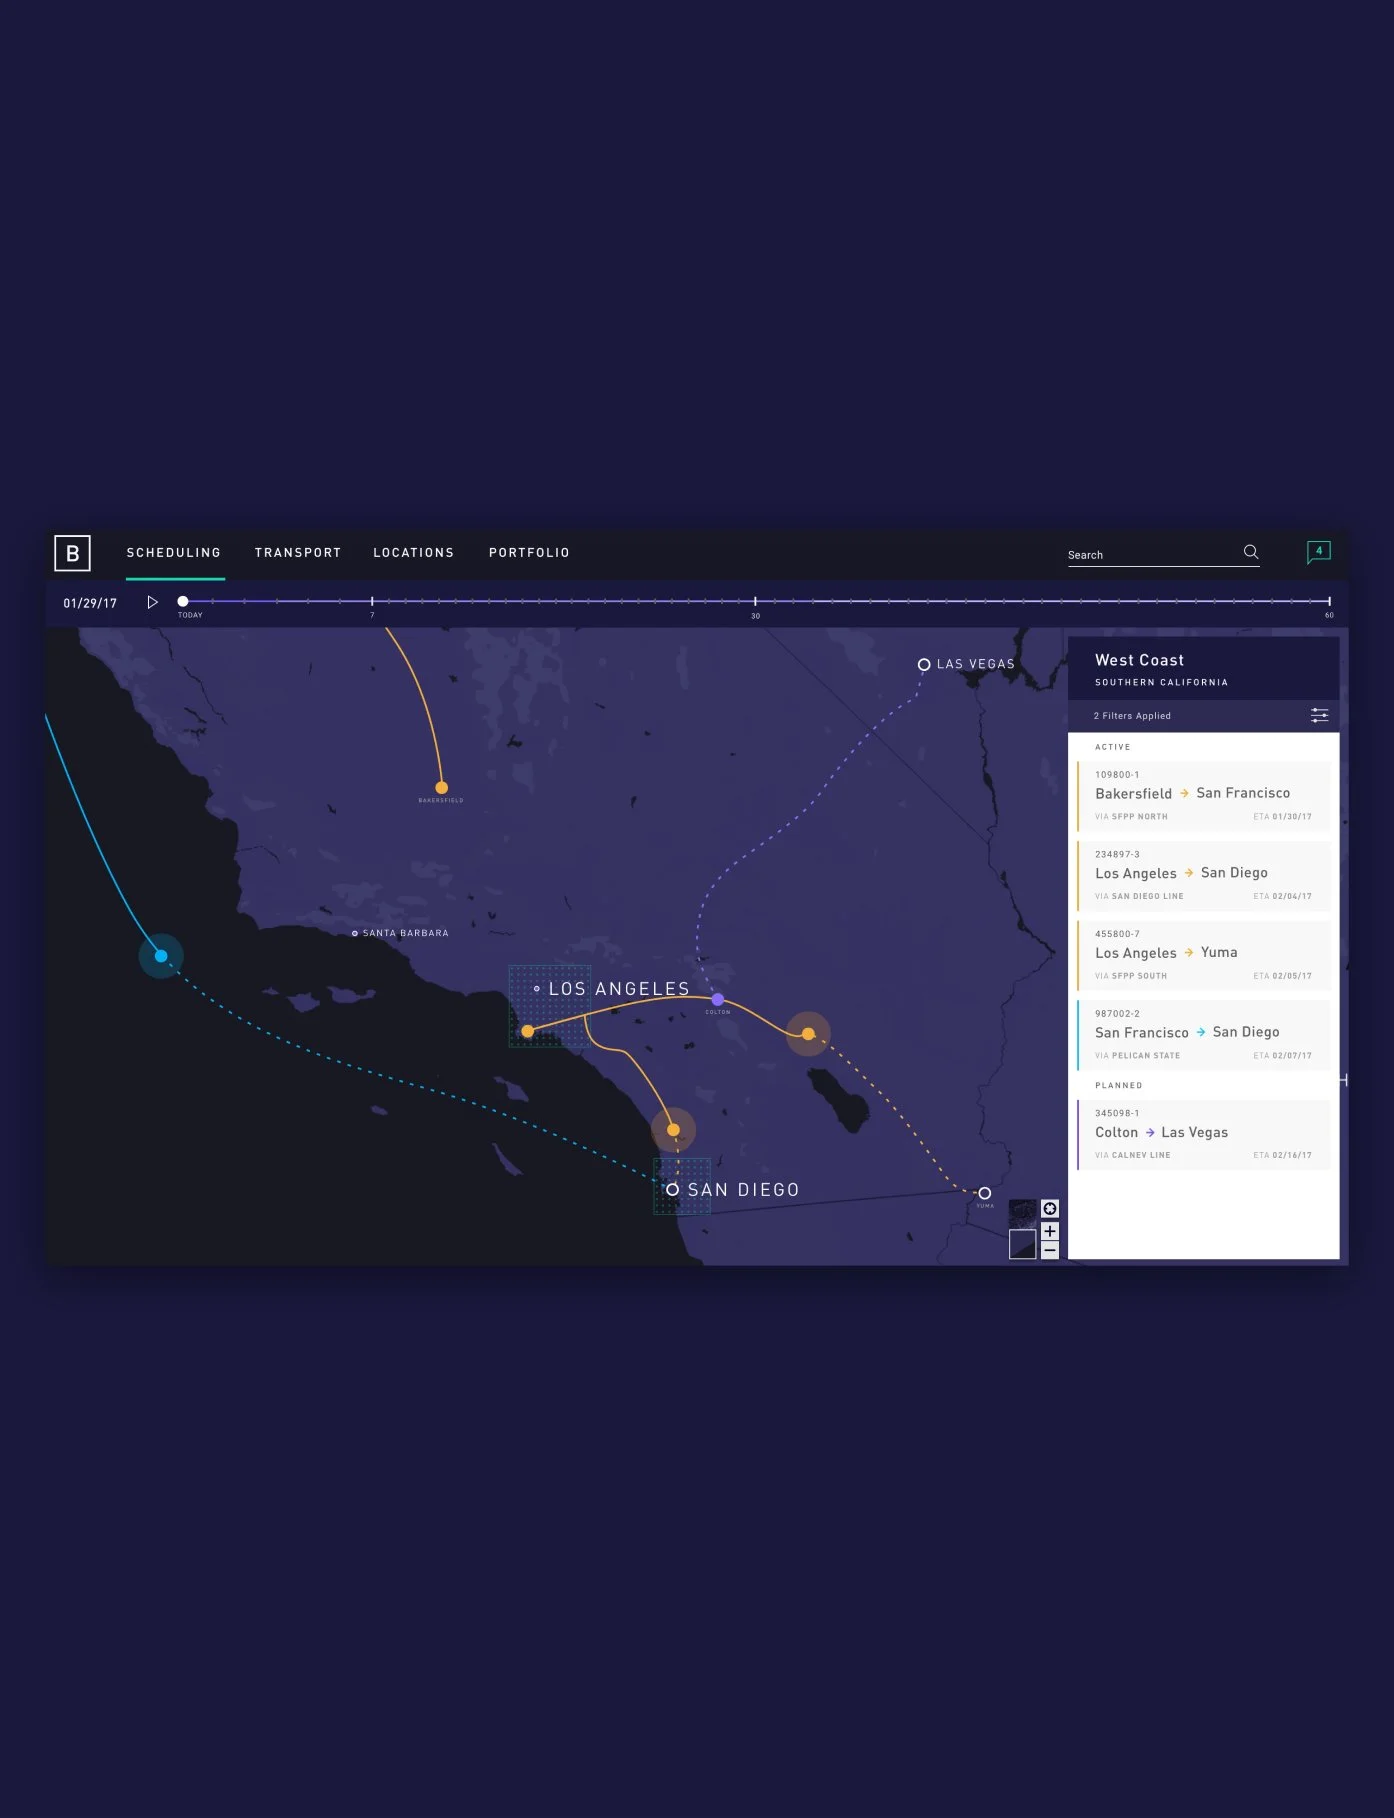
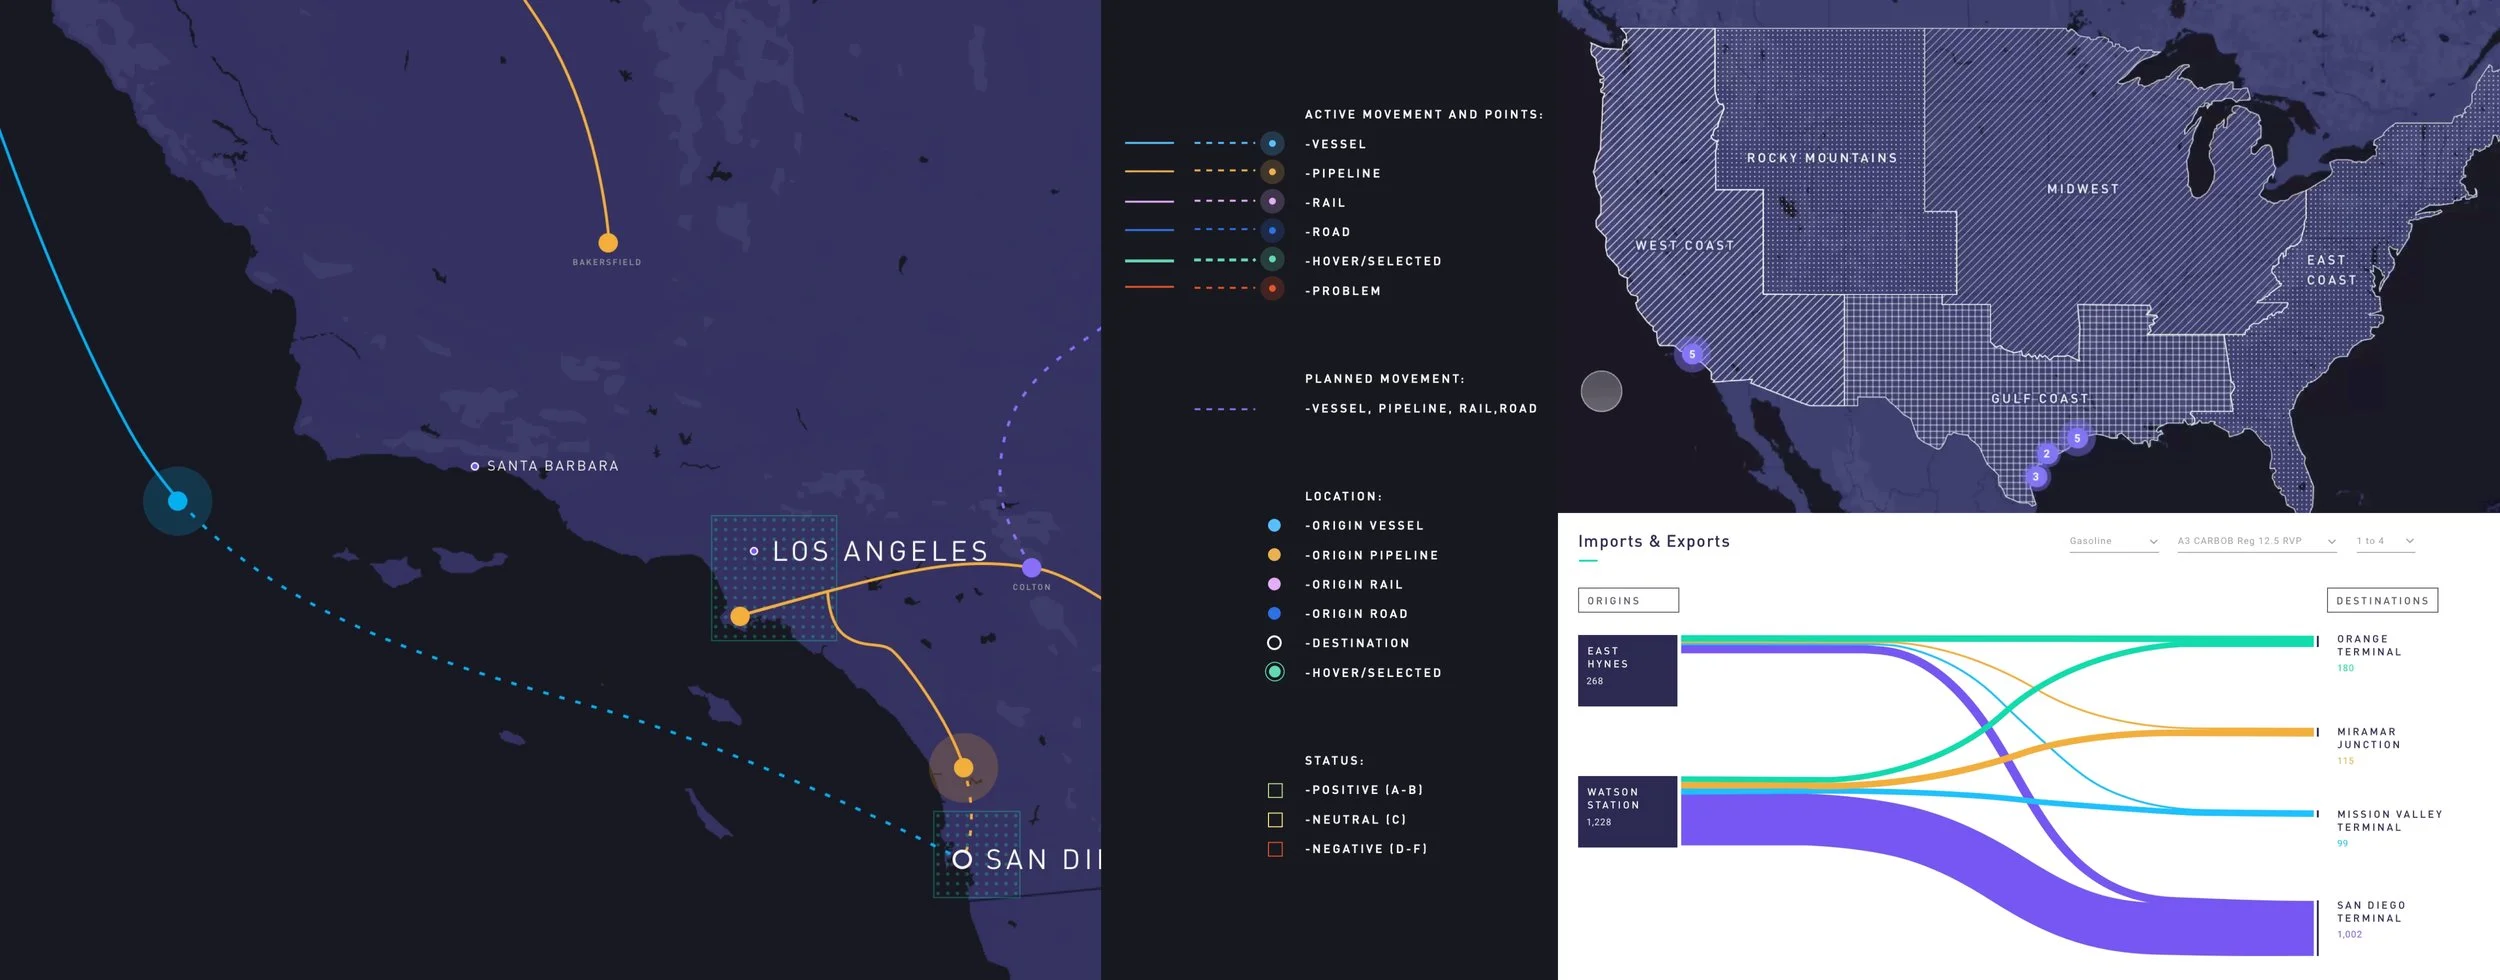
We used map-based navigation, real-time data visualizations, and dynamic information graphics, to consolidate large data sets into a single view. We developed a range of data visualizations and mapping components that allow schedulers to rapidly and precisely interpret massive amounts of information and mitigate risk by making more informed decisions.
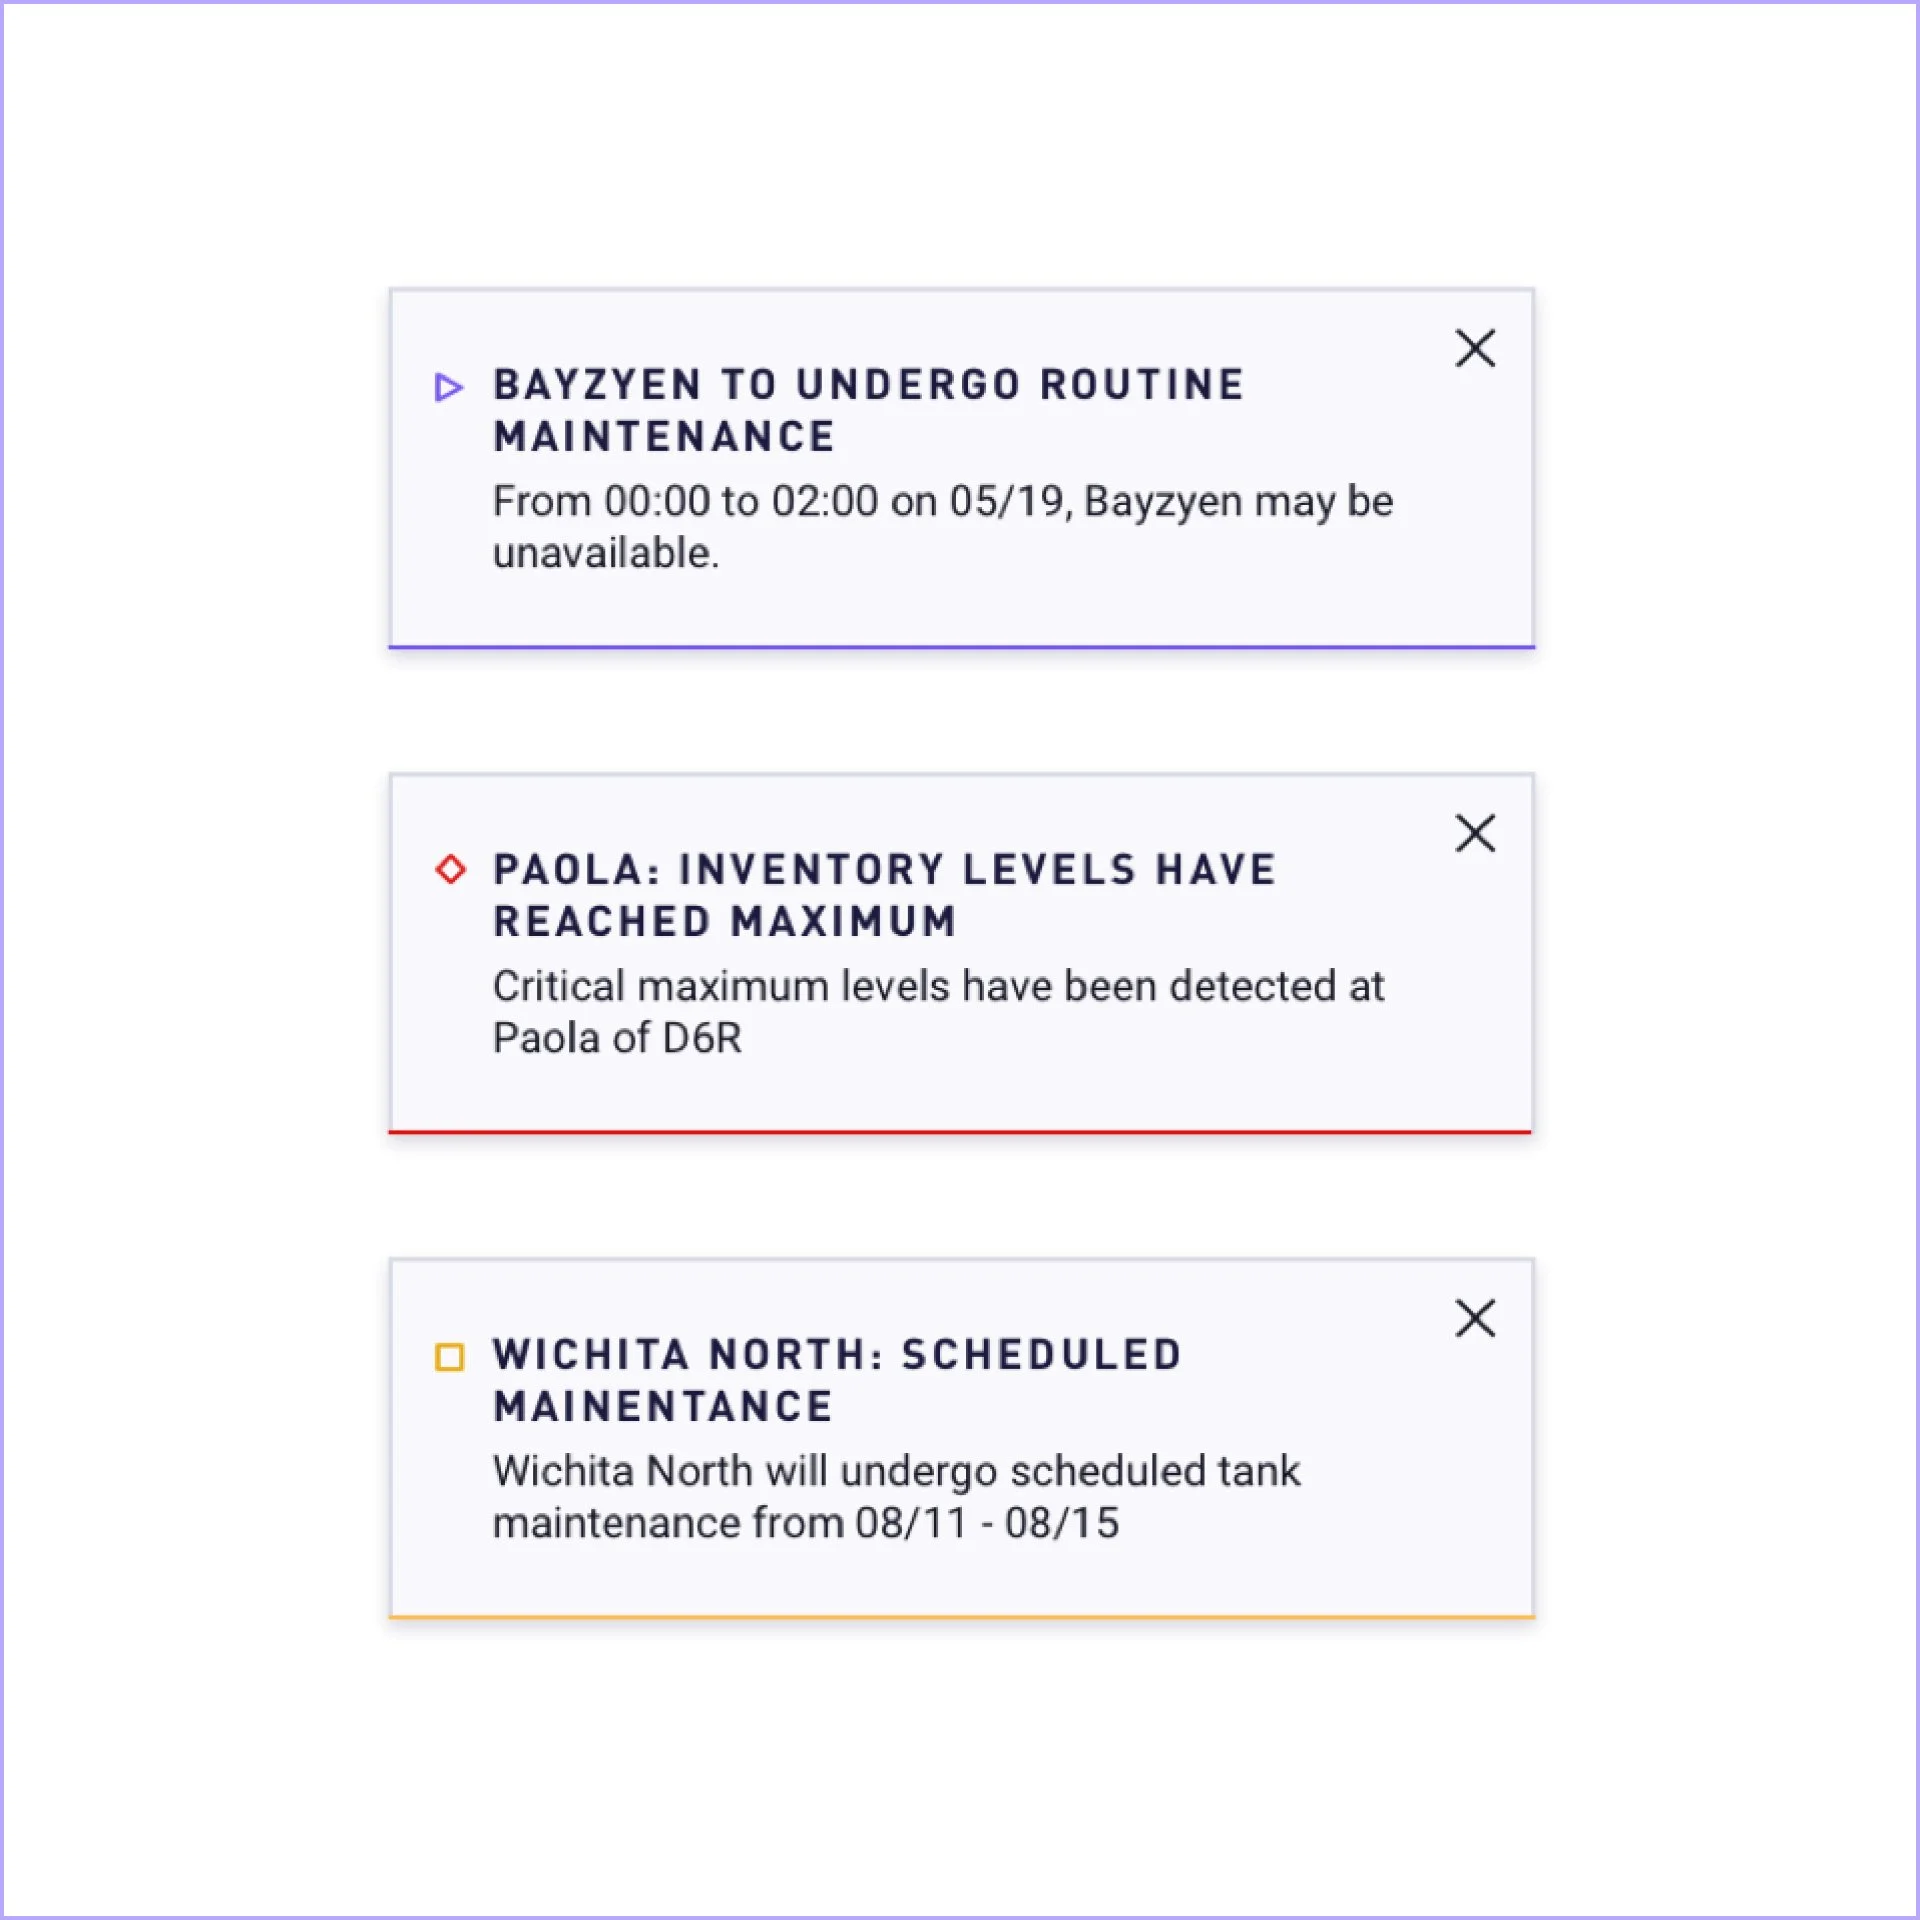
Scalable Design Language
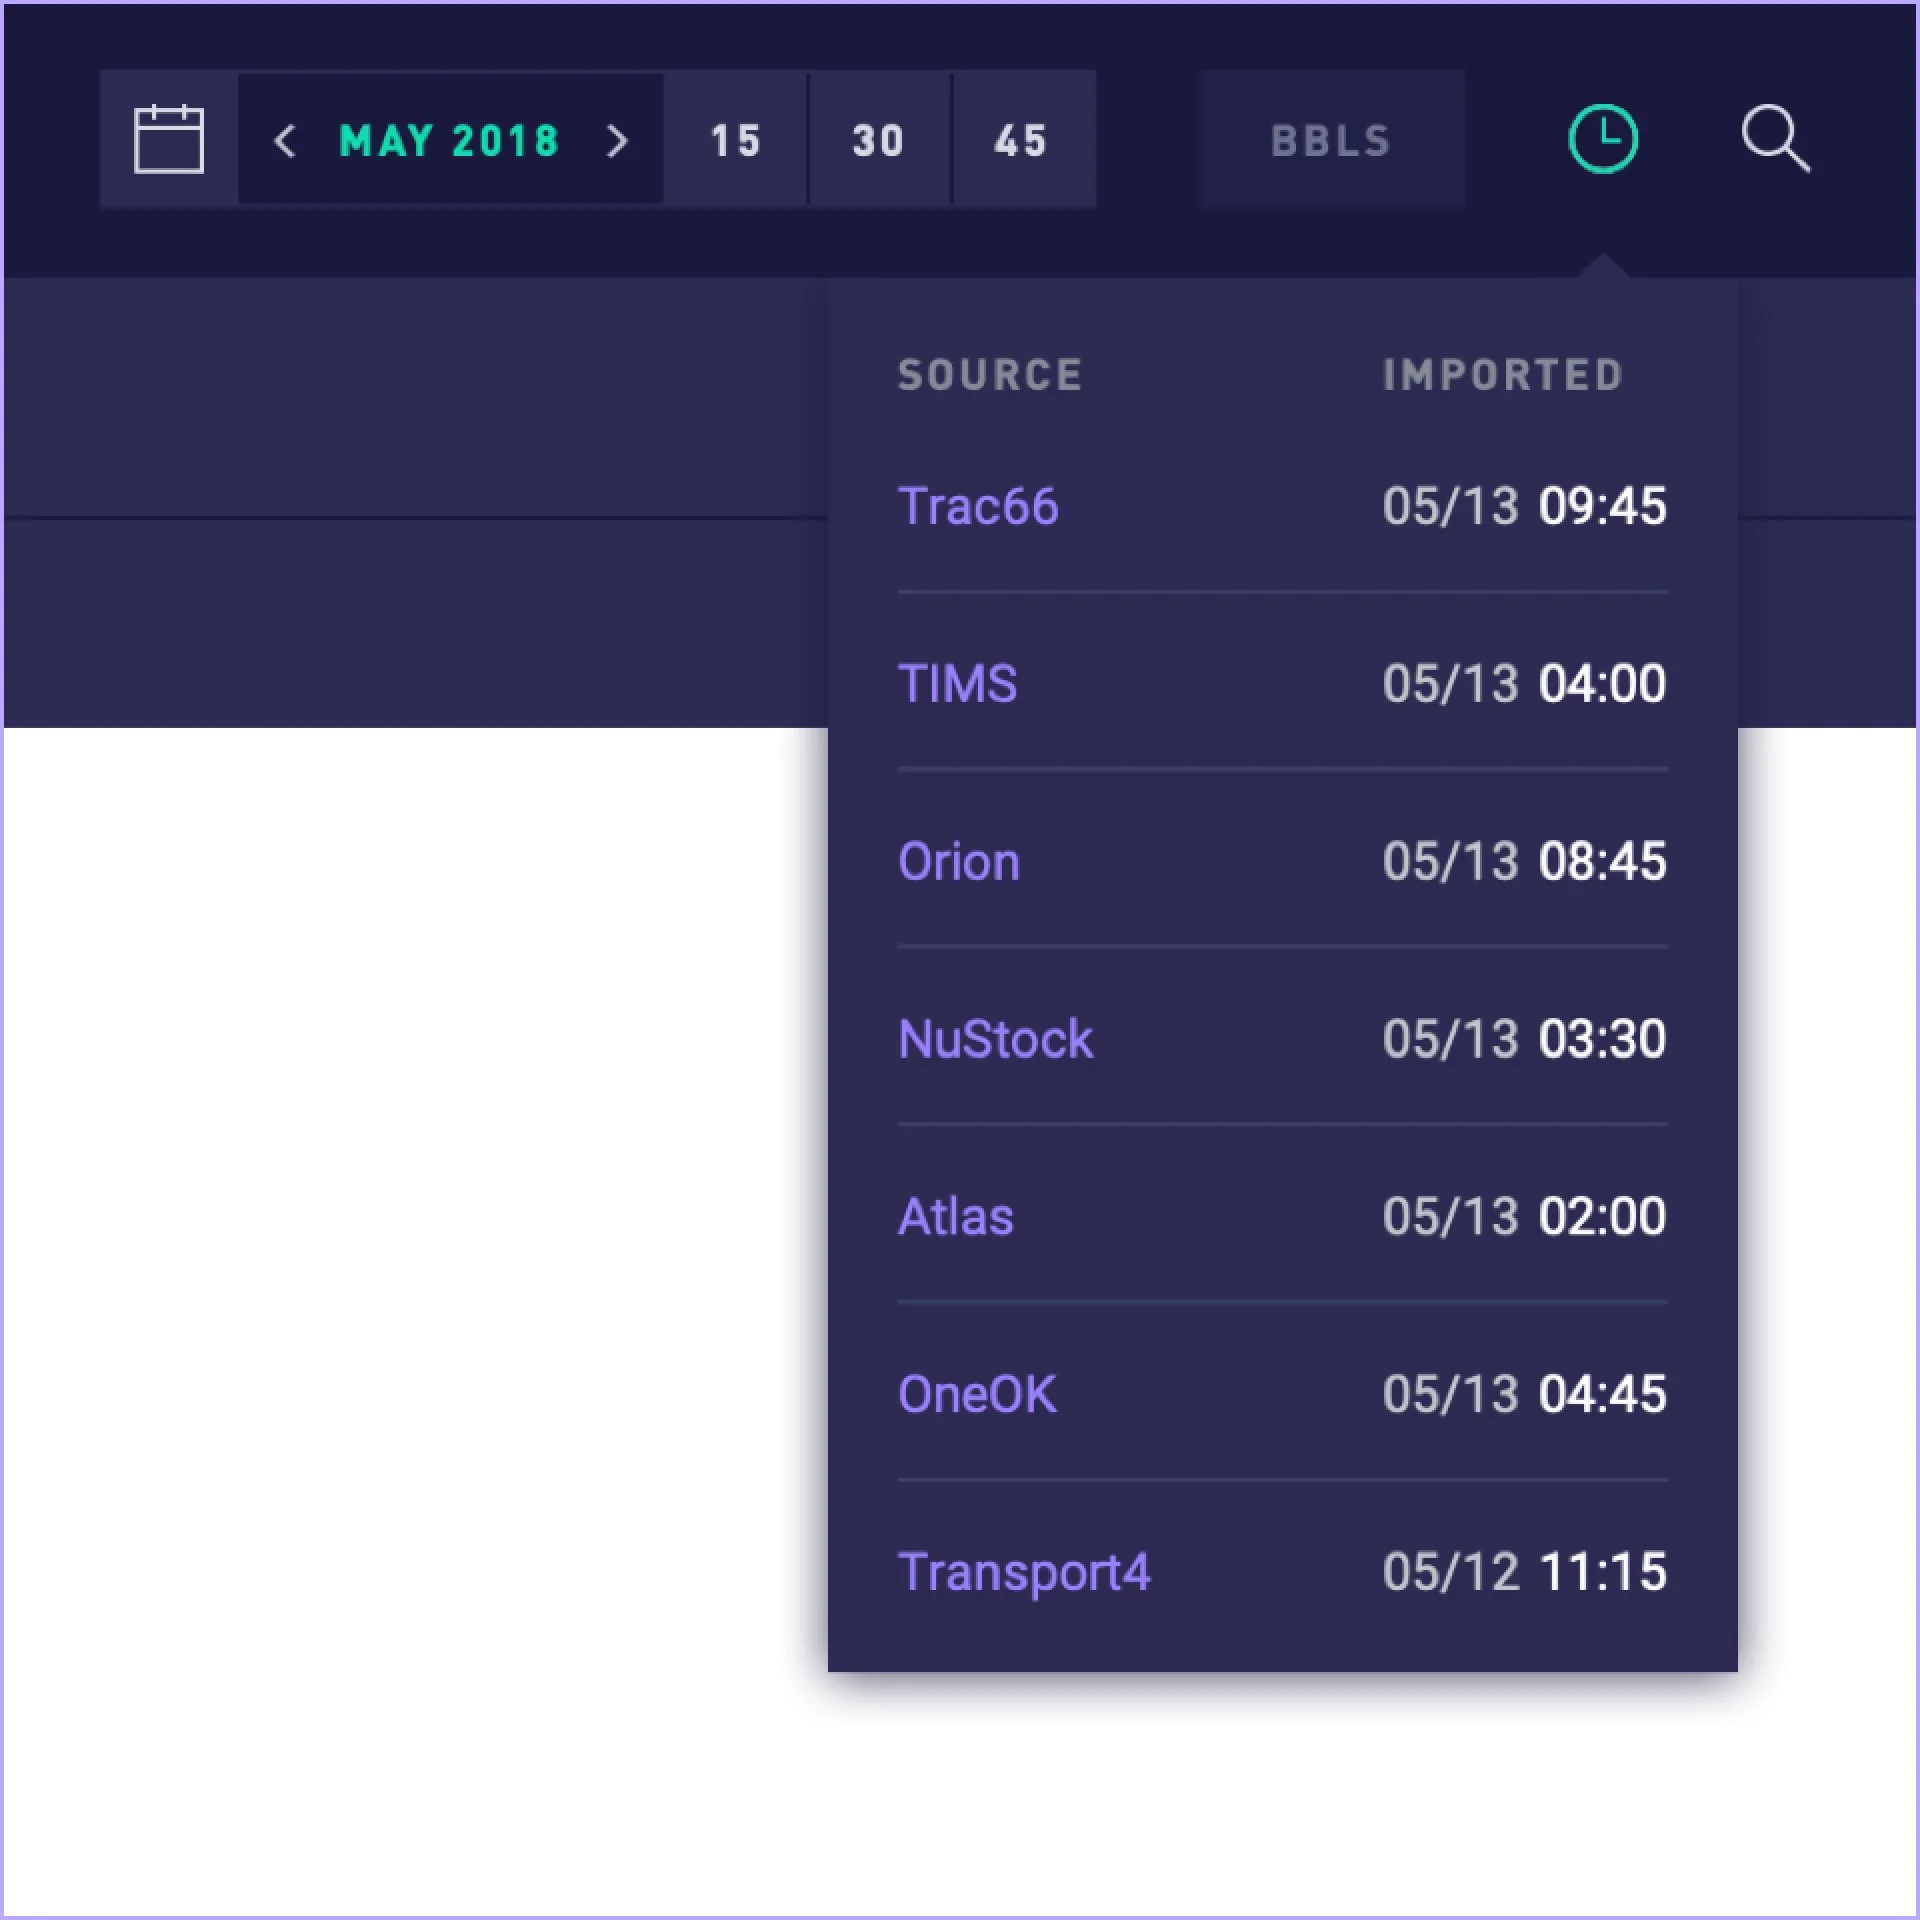
User-friendly Features & Controls
A New Vision for Supply Chain Management
Developing Bayzyen
During the engagement, the design team worked closely with the development team to assess the technical feasibility of implementing our designs. Utilizing a library of React components, allowed design and development to iterate and build quickly.
User Testing
To ensure we were meeting user expectations, we conducted iterative validation sessions with schedulers we had previously interviewed. The feedback gathered influenced our final screen designs and helped increase user adoption.